Before beginning the performance study using CRISTAL planned configuration, it is first necessary to define a reference snowpack, around which we will study the sensitivity of the altimetry measure to snow and topographic parameters. Without any precise snow in-situ measurements available yet, it was decided to use realistic ranges of snowpack parameters from lake Vostok and slightly tune the parameters to assess if the simulations can match real acqusitions.
In fact, the large and flat surface of lake Vostok (~15 000km2, surface slope ~0.0025%) is an ideal calibration site for altimetry. The flat surface prevents from topographic effects that can also modify waveform shape. The lake Vostok waveforms are well characterized from recent studies made at CLS, in LRM/SAR and Ku/Ka bands [Aublanc et al., 2017], and are displayed in Figure 22 (left column).
First sensitivity studies conducted by IGE show that the main parameters acting on the waveform shape over ice sheets are the density, the snow grains size and the mean square slope. To define the reference snowpack the following methodology was taken:
- Density is set at 320 kg.m-3 , which is for instance the averaged surface density at Dome C [Picard et al. 2014]
- We search [snow grain size ; mean square slope] realistic couple of values that reproduce fairly the waveforms shape measured over lake Vostok:
- For the snow grain size parameter, simulations were performed with varying values for a radius between 100µm and 500µm.
- The Mean Square Slope (MSS) over snow is not very well referenced in the literature. Nonetheless, nadir MSS can be theoretically computed using the following equation:

-
-
- With R0 being the Fresnel coefficient, with a value expected around ~0.15 over snow [Davis et al. 1993].
- With s° being the radar backscattering coefficient. It is not straightforward to find a realistic value for lake Vostok.
-
=> Finally, regarding the parameter uncertainty, a relatively large range of variation was chosen for the mean square slope: from 0.01 to 0.05
In the end, the final reference single-layered snowpack was defined using the following snow parameters:
- Density = 320 kg.m-3
- Snow grains radius = 225µm
- Mean square slope = 0.03
The figure below displays the mean real acquistions made over lake vostok (top), and the corresponding simulations using SMRT/AltiDop (bottom). Please note the mean ocean acquisitions are also displayed in black, just for the comparison.
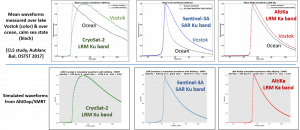
All the simulated waveforms are very consistent with real acquisitions made over lake Vostok (left column). In particular the simulated LRM Ku-band waveform (green) reproduces well the leading edge inflection observed at mid-power. In LRM Ka band (red), volume scattering has relatively low impact on the waveform shape, neither in simulation nor in the real data, as expected. In SAR Ku band (blue) the volume effect can be observed in the trailing edge, and simulated/real waveforms are comparable. Nonetheless, the SAR Ku simulated waveform is slightly peakier, suggesting that there is room for improvement, in particular for snow / radar wave interactions at the very top of the snowpack. Besides, it could also be a limitation of using a homogeneous snowpack, neglecting the snow parameters vertical variations.
This reference snowpack was empirically built, using the AltiDop/SMRT model not yet fully validated. We are aware that is not the best and proper way to define the reference snowpack of the study. Nonetheless, without precise snow and roughness in-situ measurements this was the best approach we could take within the available time of the study.
A clear evaluation of the AltiDop/SMRT model will be mandatory to characterize its validity. Such an evaluation must be performed with snowpacks built with in-situ measurements. This work is on-going at IGE and a scientific is currently being written.
SMRT/AltiDop simulations using CRISTAL configuration
Using CRISTAL altimeter configuration, waveforms weresimulated in LRM/SAR modes and in Ku/Ka bands:
- Frequency = 35.75GHz in Ka band / 13.5GHz in Ku band
- Bandwidth and sampling = 500 MHz
- Pulse length = 49µs
- Antenna aperture = 0.43° in Ka band / 1.04° in Ku band
- Antenna gain = 50.1dB in Ka band / 42.1 dB in Ku band
- Pulse Rate Frequency = 18kHz
- Burst Rate Frequency = 80Hz
- Pulses per burst = 64
- Burst per 20Hz radar cycle = 4
- Satellite altitude = 800km (arbitrary choice, same as Sentinel-3A)
- Reference gate = gate 44 (arbitrary choice, same as Sentinel-3A)
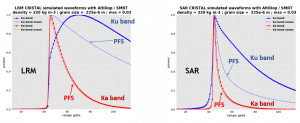
The Figure below shows the LRM waveforms (left) and SAR waveforms (right) simulated with the AltiDop/SMRT numerical tool using the ice sheet reference snowpack (see validation).
Note: the PFS waveforms from AltiDop are also displayed in dotted line for comparison, corresponding to the signal at snow/air interface (no volume scattering). In Ka band PFS is almost superimposed with the global signal, as expected.
CRISTAL is planned to acquire waveforms in 1024 range gates, which is a long window analysis, 4 times longer than Sentinel-3A for instance. Nonetheless, to reduce the important simulation CPU time in SAR mode, data were simulated with an optimized number of range gates:
- In Ka band, due to the narrow antenna aperture (0.43°), 128 range gates are sufficient to capture the antenna pattern useful energy. At the end, there is approximately 80 useful looks, that contain enough energy to efficiently reduce speckle noise during the multi-looking operation.
- In Ku band, the antenna aperture is wider (1.04°), therefore 256 range gates were used to capture the antenna pattern useful energy. There is approximately 160 useful looks that contain enough energy to reduce speckle noise. The ratio of useful looks between Ku and Ka bands is relatively comparable to the antenna aperture ratio of both antennas.
(we considered looks as “useful” when their maximum energy reach ~10% of the central looks energy.)
In the end SAR Ka band waveforms appear to be highly peaky, due to the specific SAR sampling, and the narrow antenna aperture. In Ku band the SAR waveform shape is much more “volumic” because of the larger antenna aperture, but mainly because of the volume scattering effect.